

NPM
Packages
Developed by 📦
Abhishek Verma
High-performing
High-impact
Scalable
Projects


[In development] The NIRMAAN dashboard has been developed specifically for the Indian Oil Corporation Limited. Its purpose is to update data related to their retail outlets, add new outlets, and validate existing ones. Additionally, the application assists in suggesting suitable locations for opening new retail outlets. To create an interactive user interface, the dashboard was developed using React and JavaScript. The design and layout were determined using HTML, CSS, JavaScript, React.js, Babel.js, Webpack, Google Maps API, and the Ant Design Framework. The application utilizes the Deck-Gl library to visualize data on Google Maps. Geocoding and reverse geocoding techniques are employed to obtain latitude and longitude coordinates and vice versa.

[In development] Lepton Software's Demographic Data Visualization Product In the realm of data visualization, Lepton Software has emerged as a trailblazer, crafting an exceptional product that unlocks insights from demographic indicators on interactive maps. This innovative creation empowers users to delve into intricate data facets such as population count, male and female demographics, working individuals, and more, all presented in a captivating spatial context. Central to this product's prowess is its ability to seamlessly translate complex demographic indicators onto maps. With granularity ranging from state-level overviews to pinpoint-specific details, users can glean valuable insights into population dynamics and workforce demographics. It's a virtual journey through socio-economic landscapes.
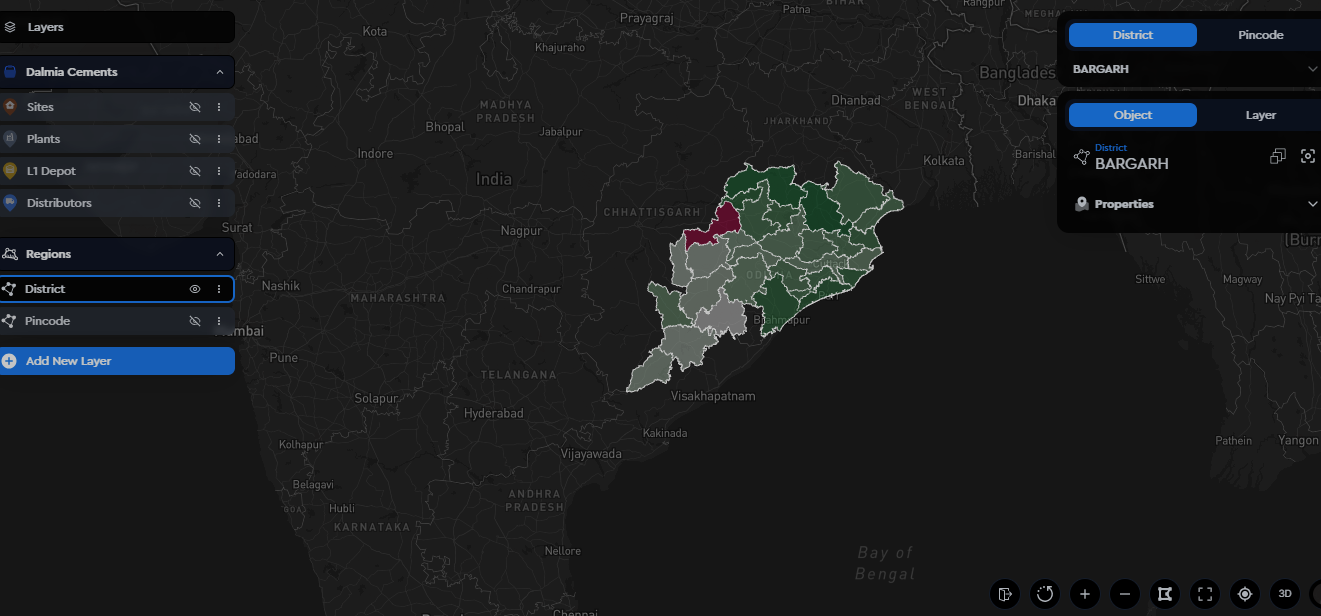

[In development] Dynamic geospatial tool tailored for data visualization on both Google Maps and Mapbox. This versatile tool allows users to effortlessly: Layered Visualization: Overlay and explore multiple data layers for comprehensive insights and analysis. Catchment Analysis: Analyze geographic influence and accessibility of a location. Intersection & Donut-Making: Precisely calculate intersections between layers to create donut polygons for in-depth analysis. Aggregation: Aggregate data across layers for in-depth analysis. Customization: Customize data layers and map styles to suit specific requirements. The tool is designed to be user-friendly, with an intuitive interface that allows users to effortlessly navigate through the various features and functionalities. It is a powerful tool that empowers users to gain valuable insights from geospatial data.

API Health and Cnsumption Moniter
[In development] That website that is designed for API health checks, monitoring, consumption tracking, and integration with Slack and email. It checks API health every 5 minutes, and if any API is found to be not working, it immediately sends a message and email until the issue is resolved. Furthermore, it stores records in a database and displays all API activities in the user interface. Additionally, it provides charts to visualize API usage and credit.

Network 360
[In development] The Vodafone Signal Strength Visualization project aims to provide users with an interactive map-based interface to visualize signal strength data nationwide. Its key feature involves dynamically mapping signal strength variations across geographical sites, enhancing user experience through intuitive visual cues. Leveraging advanced data fusion and visualization technologies, the project transforms raw signal metrics into actionable insights. By enabling a comprehensive understanding of signal coverage patterns, Vodafone can make data-driven decisions to optimize network performance and enhance the customer experience.
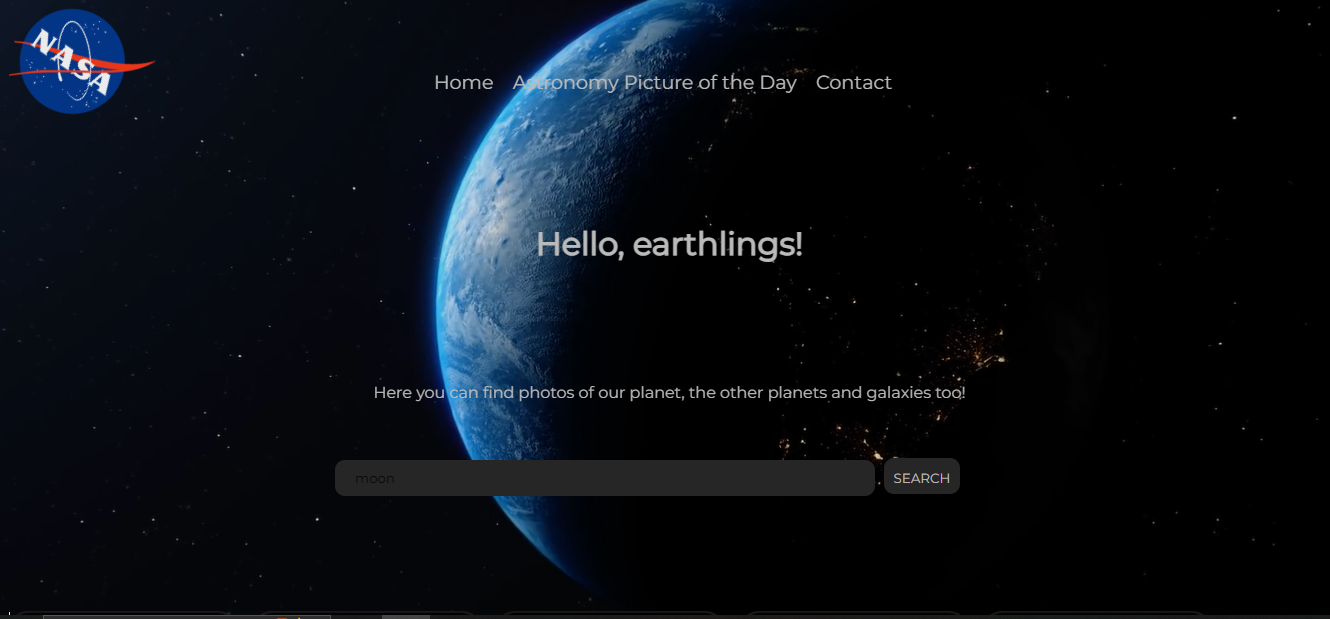

[In development] Nasa Informative stands as a robust platform, housing an immense repository of over 140,000 NASA image files. These visuals span a multitude of NASA missions across aeronautics, astrophysics, Earth science, and human spaceflight. The website boasts an intuitive interface that guides users through this treasure trove of images. Recent uploads, historical captures, and daily "image of the day" features beckon exploration. Beyond browsing and downloading, Nasa Informative furnishes invaluable metadata for each image. Key information like mission details, dates, locations, and contextual insights enrich the exploration experience, painting a more comprehensive picture.
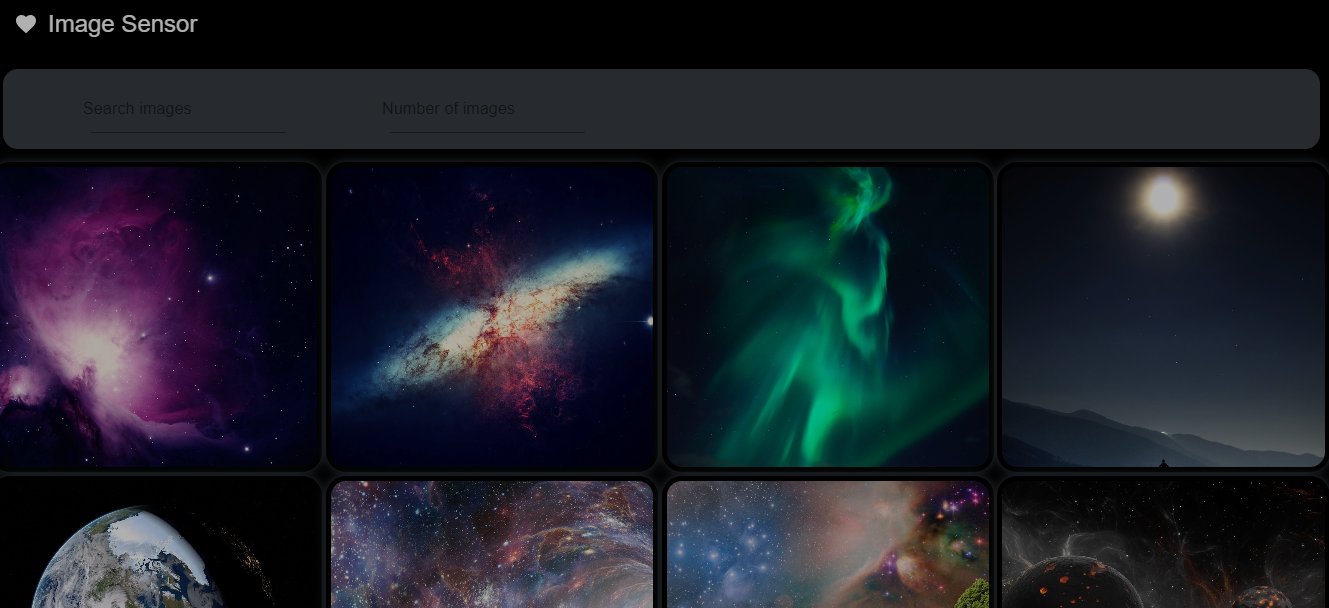

[In development] Project that can automatically discover and display a wide range of images from around the world, encompassing various formats such as JPG, PNG, vector graphics, and SVG. Additionally, the project should offer users the ability to tailor their search parameters and customize how the images are presented, including options for rendering and specifying the number of results.

🪐
"I am Passionate coder along with a cosmic journey, deeply engaged in space research and exploration as both a dedicated researcher and a citizen scientist."
ORBITX INDIA AEROSPACE (p) LTD
NASA - National Aeronautics and
Space Administration